How do I compare labour cost with the budget?
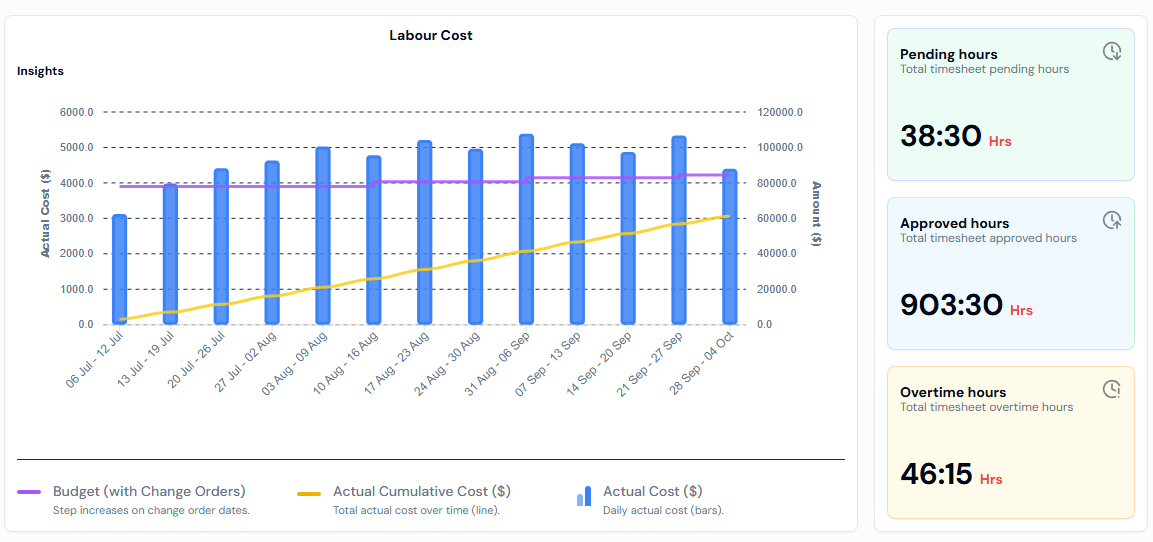
Use the Labour Cost chart on the Budgets page. If the Actual Cumulative Cost line gets close to, or goes above, the budget line, the project is at risk of going over budget.
Before you start
- The project needs at least one budget.
- Actual cost is worked out from workers' pay rates. Make sure each worker has a pay rate, or the figures may be too low.
Steps
- In the left menu, under Finance, click Cost Management, then Budgets.
- Click the Project: button and pick the project.
- Optionally, click the date button and pick a start and end date.
- Read the Labour Cost chart and the hours cards beside it.
What the chart shows
- Actual Cost ($): money spent in each period. Each point is a day, a week or a month, depending on the date range.
- Actual Cumulative Cost ($): the running total of money spent.
- Budget (with Change Orders): the budget level, including change orders. Only shown when the budget has change orders.
Timesheet hours cards
- Pending hours: timesheet hours still waiting for approval.
- Approved hours: timesheet hours that have been approved.
- Overtime hours: total timesheet overtime hours.
Good to know
- Actual figures come from the hours workers record against the project in their timesheets.
- A high Pending hours figure means actual cost could still go up once those timesheets are approved. See How do I approve or reject timesheets?
- For the money and hours cards, see How do I read the budget page?