How do I understand my Dashboard?
Help Centre category: Getting Started
What this helps you do
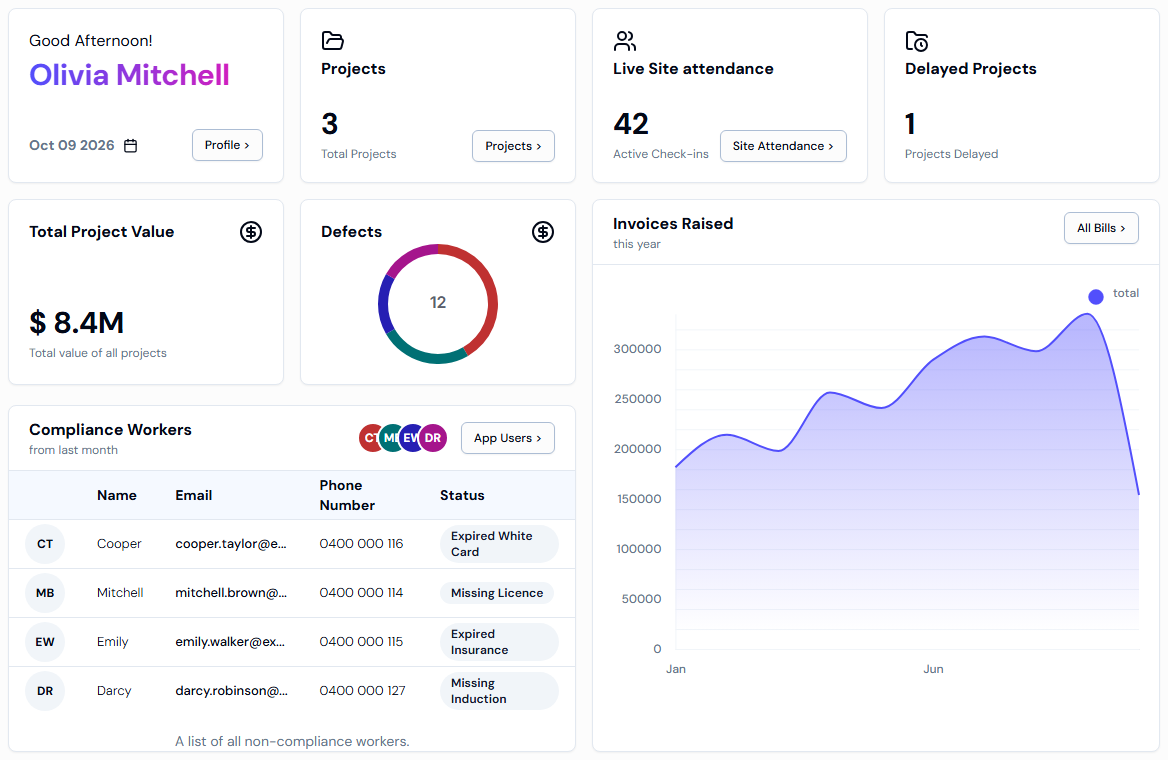
The Dashboard is the first page you see after you log in. It gives you a quick summary of your business in one place, so you can see at a glance:
- how many projects you have,
- how many workers are on site right now,
- which projects are running late,
- which workers need follow-up, and
- how much you have invoiced this year.
Before you start
- You need to be able to log in to the SwiftCheckin website as an admin.
- Some buttons on the Dashboard only appear once your organisation has at least one project. See Why can't I see the Projects or Site Attendance button?
Steps
-
Open the Dashboard. It opens on its own after you log in. To come back to it later, click Dashboard in the left-hand menu, under Platform.

-
Check how many projects you have. Look at the Projects card. Total Projects is the number of projects in your organisation. Click Projects > to see the full list.
-
Check who is on site right now. Look at the Live Site attendance card. Active Check-ins is the number of workers checked in on site at this moment. Click Site Attendance > to see who they are and where.

-
Check for late projects. The Delayed Projects card shows how many projects are running behind schedule.
-
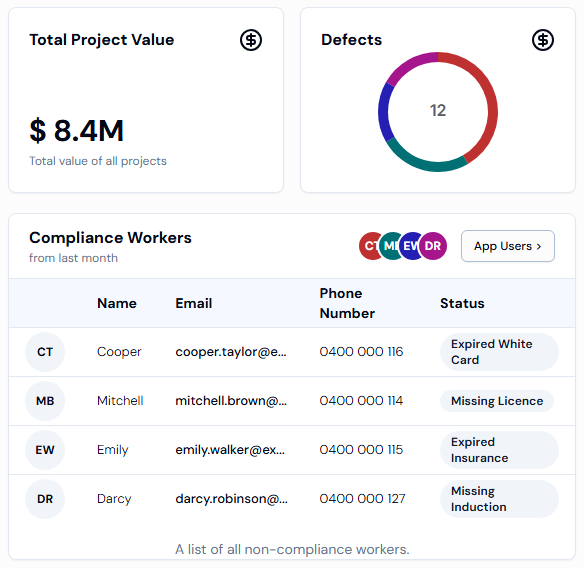
Check the value of your work. Total Project Value is the combined value of all your projects. Large amounts are shortened, so $1.5M means 1.5 million dollars and $250K means 250 thousand dollars.
-
Check for defects. A defect is a problem found in the work on a project. The Defects ring chart groups them by the reason they happened. Each colour is a different reason.
-
Check which workers need follow-up. The Compliance Workers list shows workers from last month who are not compliant, for example because their documents are missing or out of date. Click App Users > to open your full list of workers.
-
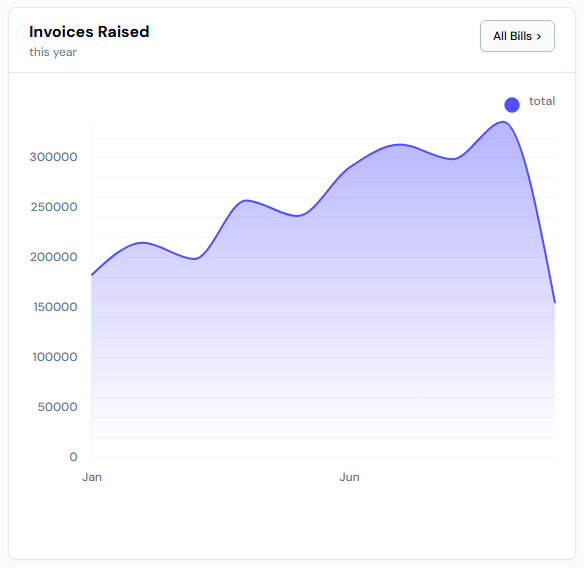
Check what you have invoiced. The Invoices Raised chart shows the total value of bills raised in each month this year. Point your mouse at a month to see its amount. Click All Bills > to open your bills.
Expected result
After the page loads, all cards show numbers or charts for your whole organisation. While the page is loading you will see grey boxes in place of the cards.
The Dashboard does not update by itself. To see the latest numbers, refresh the page.
Troubleshooting
Why can't I see the Projects or Site Attendance button?
The Projects >, Site Attendance > and All Bills > buttons only appear when a project is selected at the top of the screen (next to Project:).
- If your organisation has projects: check that a project name appears next to Project: at the top of the screen. If not, click it and choose any project. The buttons will then appear.
- If your organisation has no projects yet: there is nothing to select, so the buttons stay hidden. An account admin will see a Create project button at the top of the screen. Create your first project and the buttons will appear. See How to create a project with site locations.
Why do the numbers look out of date?
The numbers are worked out when the page opens. Refresh the page to load the latest figures.
Why does it say "Something went wrong in getting dashboard details."?
The Dashboard could not load its information. Refresh the page. If the message keeps appearing, contact SwiftCheckin support.
Why does a card say "No defects found !" or "Compliance Workers Not Found !"?
This is good news. It means there are no defects recorded, or no workers need follow-up for last month.
Why can't I see Dashboard in the left-hand menu?
The menu only shows the features that are turned on for your organisation. Ask your account admin or SwiftCheckin support to check that the Dashboard is turned on.